Similar Projects | All Projects for Client
The world famous Napa Valley runs through the county of Napa in the northern Bay Area. A long history of citizen action has created many protections for both the valley floor lands and the surrounding watersheds. But challenges still remain and the Napa landscape is vulnerable to excessive development, given the area's popularity. The Davies Fund supports efforts to protect Napa's natural resources and asked GreenInfo to help develop maps illustrating key issues, for use in public presentations.
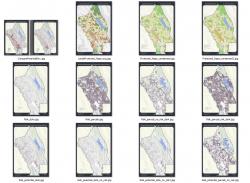
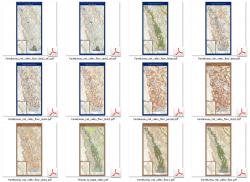
The early work on this modest-budget project revealed that matching available GIS data from Napa County to the issues seen by the Fund was going to be more complicated than expected. GreenInfo staff worked with the Fund's directors and staff and explore what could be shown, and to see how that affected their understanding of Napa's situation. Ultimately, many different working maps were created by GreenInfo, so that the Fund could visualize their choices, including maps of:
- County zoning
- Protected areas (from GreenInfo's California Protected Areas Database, CPAD, and the CCED easement database)
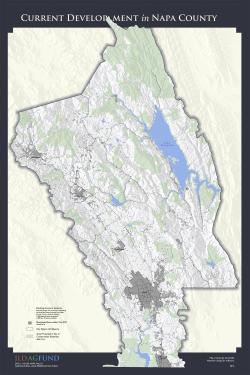
- Current development footprints
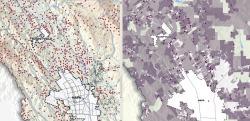
- "At-risk" lands (learn more)
- Views of just the Napa Valley floor
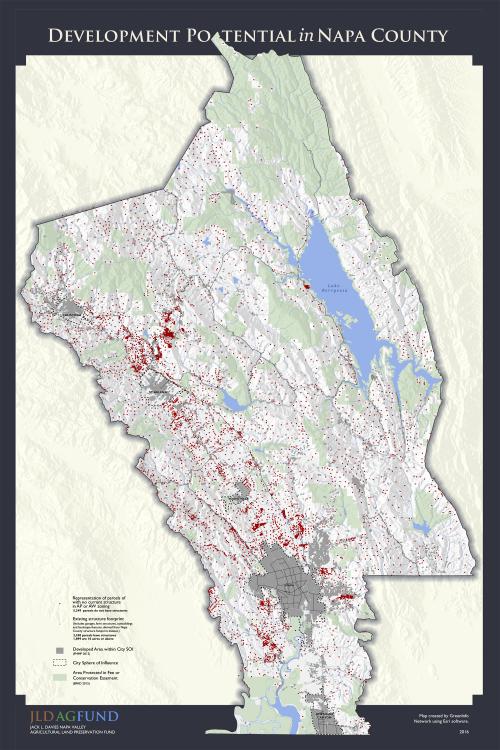
Finally, we created a "look and feel" for the Fund's maps, using its logo colors and and designing the map frame to account for the unique "extrusion" of the county at the far north end. This required a special approach to ArcGIS mapping that allows the map to overlay the title banner (not straight-forward in GIS!).
The final maps were pared down to two, though others are also available to the Fund - current development footprint (of buildings) and potential development, represented as points based on zoning criteria, placed in each parcel. The maps are designed to be viewed at poster size - 36" x 48" - all cartography is focused on the viewer's experience first seeing these at 3 to 5 feet, and then moving closer up for details. In addition to the maps, we also prepared summary statistics about each view, defining in acres the various categories of development.
Focus: Conservation
Services: GIS Services, Communications, Strategy, Maps
Tags: Esri ArcGIS, Napa County
Project Years: 2015-2016