See This Project | Similar Projects | All Projects for Client
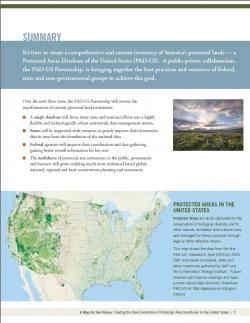
Protected lands are challenging inventory as GIS data - federal, state, regional, local, nonprofit and other owners are scattered across 3,000 counties and even more agencies. But getting this data well defined is crucial for biodiversity planning, provision of recreation, planning for alternative energy sources, adapting to climate change and more. GreenInfo was asked to coordinate a project to define a way forward in building a better protected areas GIS inventory.
Over a year and a half, a small team representing government and nonprofit experts on inventorying protected areas moved to produce a report that could educate key policy makers, funders, biological experts, GIS practitioners and more - all in all, a very wide ranging audience. GreenInfo Network, which was facilitating the discussion, took on the job of developing this report, including the structuring and writing of the overall message, the graphic design and the production of the final document.
The first task was to negotiate a basic outline of what to cover and then to define the hierarchy and sequence of key findings that the group wanted to present. Early in this process, GreenInfo began mocking up basic graphic design concepts to help determine the length and purpose of text and graphics, given the desired messages. Our design partner, Ison Design, worked closely with GreenInfo staff to create a layout concept for the report, which enabled more specific editing of the report text - both writing and design moved in parallel.
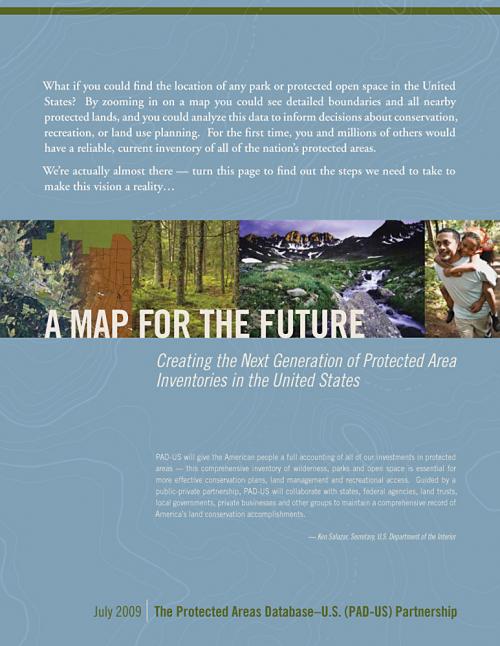
The design approach chosen by GreenInfo emphasized the importance of the report being easily accessible to those who would just browse it, as well as having clearly written text for thorough readers. This meant having an open design, with lots of graphic "hooks" to grab attention and encourage more in-depth review. GreenInfo developed content mockups of key graphics, got group buy-in and then engaged Ison Design in final production. GreenInfo also researched photos and developed maps for the report. The final report of 24 pages was produced at a digital on-demand press. The report featured a supporting quote from the Secretary of the Interior and was widely distributed in the department. It has remained the guiding document for the USGS Gap Analysis Program, which has continued publication of the Protected Areas Database of the U.S. (PAD-US).
Results: USGS has continued to use the strategy defined in this report to guide the evolution of the PAD-US data set of protected lands.
Focus: Conservation, Government Agencies
Services: GIS Services, Communications, Graphic Design, Strategy, Publications, Maps
Tags: GAP, PAD-US, Protected Areas, USGS
Project Years: 2008-2009