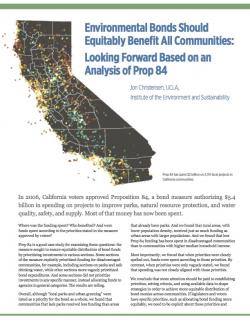
How did California spend the $4 billion from Proposition 84, passed by voters in 2006? With support from Resources Legacy Fund, we worked with Jon Christensen of UCLA to find out. After extensive data gathering and GIS analysis, two conclusions stood out: Bond funds are better spent when criteria are clear, and tracking spending is a lot easier when we plan up front for gathering data.
For this project, we worked closely with UCLA to assemble, clean, and analyze data and than develop both interactive and print methods to present that data in a way that tells a clear and compelling story about how California can and should track bond funds similar to those distributed under Proposition 84.
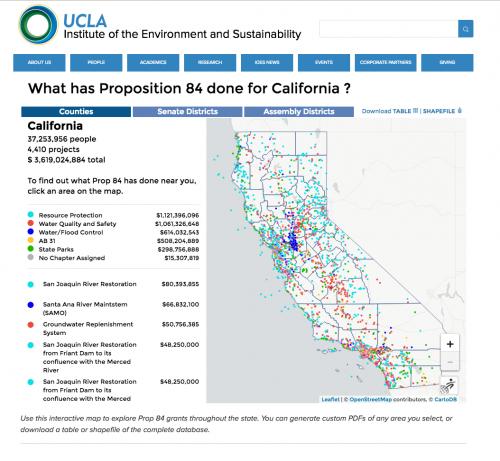
Starting with basic grants data from the state, we worked with Jon Christensen of UCLA to group grant locations across a dozen different spatial slices for analysis of results, from census tract up to senate district. We crossed the points with CalEnviro Screen and sifted out duplicates, non-location-based funding, and other edge cases to ultimately produce a dataset that formed the basis of subsequent work. Then, while UCLA developed the report language, we designed and built an interactive web map and a set of simple but visually compelling print maps. Stamen Design provided design consultation on the interactive map as well.
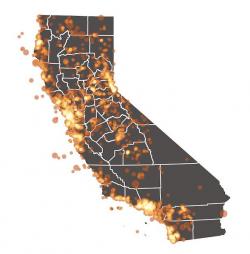
The web map uses Leaflet to display data, combined with custom JavaScript and a little PHP for data filtering and processing. The application also dynamically generates PDF reports for any selected geometry for use by policymakers interested in specific counties or legislative districts. In print, we used the ope-source GIS tool QGIS to achieve Photoshop-like blending modes that allow a static map to give a strong sense of point density.
Focus: Environment, Government Agencies
Services: Interactive Solutions, GIS Services, Communications, Graphic Design, Publications, Data, Web Mapping
Project Years: 2015,2016