Similar Projects | All Projects for Client
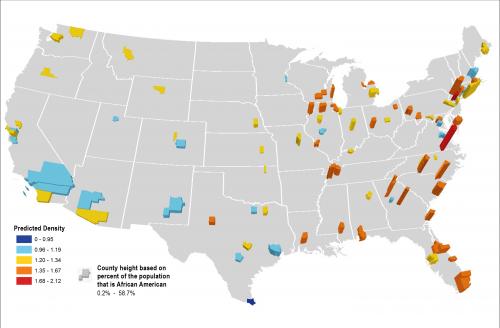
The Stanford University Prevention Research Center has used GreenInfo Network as a resource for processing and analyzing geospatial data for years. The most recent example is a quickly produced map of counties in the United States illustrating the predicted density of African American Smokers in the U.S.
When a last minute presentation map was needed, staff at the Center knew to call on GreenInfo Network. We were able to quickly produce maps illustrating the statistics they needed to show the results of their research project. The map design, indicating counties in the United States with their predicted density of African American Smokers, was developed using a 3D view and the layout was kept clean and simple.
Results: The resulting maps were a key element of a lighting style talk meant to highlight current research by the Prevention Research Center.
Focus: Public Health
Services: GIS Services, Analysis, Maps
Tags: Esri ArcGIS, smoking, tobacco
“ Thank you for working so fast and furiously to create such a great visual. This presentation is like speed dating — each aim is allowed only one slide, and yours definitely wins the prize!”
— Lisa Henrikson, Stanford University Prevention Research Center
Project Years: 2012-2013