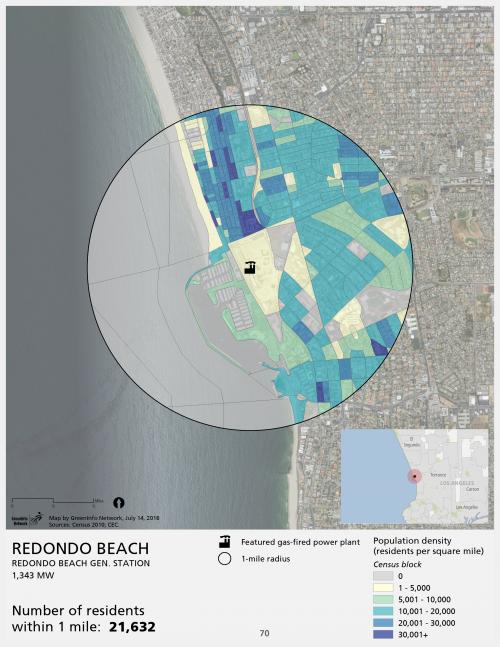
The City of Redondo Beach needed help contesting the opening of a new gas-fired power plant in their city. They had observed that population density around the proposed plant site was significantly higher than that of similar plants across the state. The City asked GreenInfo Network to conduct a visual assessment of population density within 1 mile of the similar power plants (gas-fired power, over 50 megawatt production) in California.
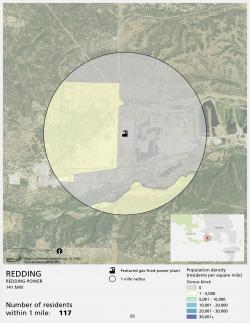
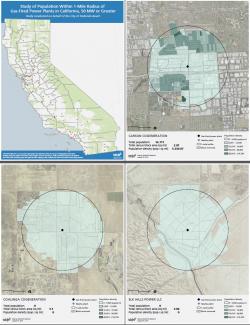
GreenInfo found that the proposed plant in Redondo Beach would have ranked 6th in the state for highest population density. To provide a detailed visual record of each plant's population density and surroundings, we created a GIS-based atlas of all 102 selected power plants. This map atlas was critical in visualizing just how different the proposed Redondo Beach plant location was from almost all other power plants in the state.
In doing the analysis for Redondo Beach, GreenInfo faced the same challenge that often occurs when assessing population densities: a 1-mile radius around these plants cuts many surrounding census blocks into little pieces all around the border of each circle. Because most of these plants were in low-density areas, the surrounding census blocks were also quite large (low population areas have larger census blocks). How could we responsibly calculate the population density for those cut census blocks? Our proportional allocation approach balances the desire to include all areas within the 1-mile radius, while also avoiding distorted population numbers. For census blocks that straddle the line of the 1-mile radius, we calculated the percent area that falls within the radius, then apply that percent to the population totals. For instance, if 25% of one census block falls within the radius, we counted 25% of the population within that census block.
Once we had the analysis, we developed display map templates that would best show information about each plant. We then used Esri's Data Driven Pages tool for ArcGIS to make a 102-page mapbook for the City. The atlas-creation tool creates a consistent layout for every page and produces a full PDF document in just a few minutes.
Focus: Environment,
Government Agencies,
Public Health,
Social Justice/Equity
Services: GIS Services, Analysis, Data, Maps
Tags: atlas,
California,
equity,
Esri ArcGIS,
Redondo Beach
Project Years: 2015