CALSTART promotes the use of clean-energy transportation. One such CALSTART initiative is funding vouchers toward the purchase of electric and reduced-emission vehicles. In 2016 CALSTART contracted with GreenInfo Network to replace their existing system of searching and filtering the list of vouchers to provide new functionality, such as exporting the filtered results and visualization of the vouchers onto a map. They also needed a process to export the vouchers from the tracking system into the new search and map system.
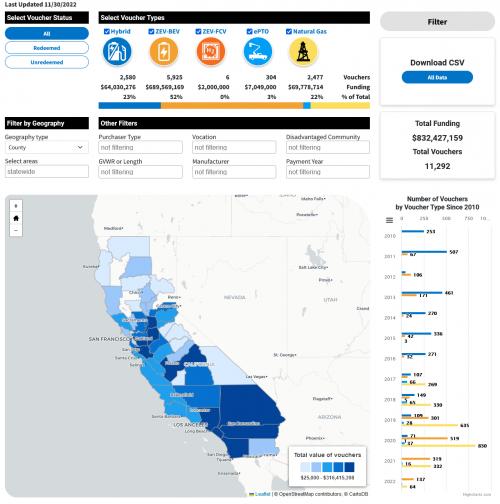
In 2022, CALSTART requested a visual update to the system, with a
more intuitive interface inspired by dashboards created by CARB and
other state agencies. We rearranged the interface to improve visual
hierarchy, added a larger summary chart with icons to draw user
attention to the important details, improved the accessibility of the
interface, and removed the reliance on CARTO as a data backend.
As
a result, the system improved user experience and made it easier for
users to access and utilize the tools and resources provided.
The first step was a data-export process to give a CSV we could use for a public web map. The original dataset contains identifying information about the vehicle purchasers, such as company names and addresses, and accurately geocoded coordinates which would be identifiable even if we removed the address field. Additionally, we noted typographical variations in some domain values, such as the vehicle type, vehicular weight, and location name, which would need to be automatically corrected. We devised a Google Sheets solution to do this, with CALSTART personnel adding new records to one worksheet and the cleaned and anonymized version appearing in a second worksheet. This second worksheet is drag-and-drop ready to load into CARTO.
Having loaded the data into CARTO, We created a pure-front-end web page to draw the visualized data and provide a filtering interface. The visitor may select from several criteria, such as vehicular weight, manufacturer, intended vocation, and whether it serves disadvantaged communities. We designed a separate custom-crafted UI to filter by vehicle type (Zero-Emissions Vehicle, Reduced Nitric Oxide, and so on) and generate statistics based on the raw data. The result is a map that updates based on the selected filters and statistical analysis of the records.
Users can download the filtered vouchers in CSV format for additional offline analysis. This also uses CARTO services without relying on a dedicated server, allowing the page to be hosted on GitHub Pages for free.
Results: CALSTART was pleased by the improvement over their prior search system and found the maps and charts helpful in generating statistics and discovering trends. Over the next year, interest in the project grew, and CALSTART received funding for additional considerations such as interface refinements, cartography adjustments, and Section 508 accessibility compliance.
Focus: Environment,
Public Health
Services: Interactive Solutions, GIS Services, Communications, Strategy, Analysis, Data, Cartography, Applications Development, Web Mapping
Tags: air quality,
transit
Project Years: 2016 - 2022