See This Project | All Projects for Client
The California Budget & Policy Center contacted us when they needed a highly customized visualization of their new Women's Well-being Index, which they developed with support from the Women's Foundation of California. They had considered using off-the-shelf tools like Tableau Public to make a visualization, but we could offer a level of customization that would ensure this innovative dataset would get noticed and get used.
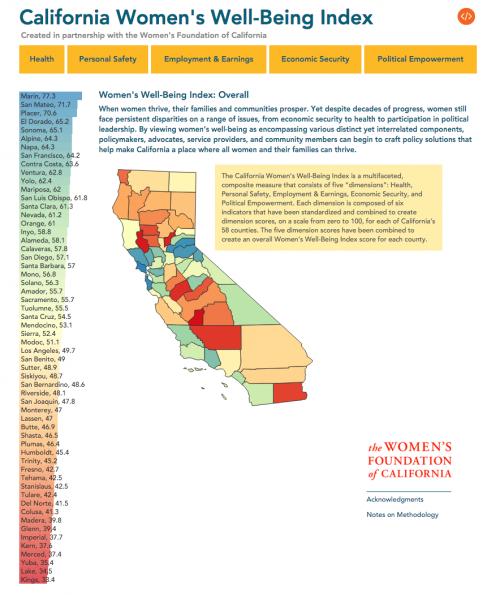
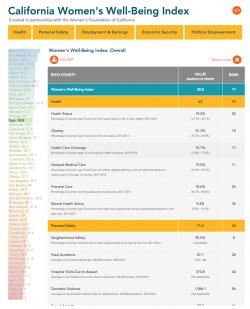
The visualization has a few key parts: A simple county-map of California, an animated sorted bar chart ranking the counties, an interactive table showing all the data for a single county, and a downloadable PDF version of that table, optimized for single-page duplex printing.
We used the D3 JavaScript library to power the map, bar charts, and data tables, which meant we could include elegant animated transitions on the bar chart, making the re-stacking of the county rankings a clear event as you move through the various parts of the visualization. And we made the system easy to update by running it all off of a trio of CSVs that are easy to edit in Excel, Google Sheets, or any other spreadsheet software. We also built the visualization to be easily embedded in other websites using an embed button that supplies the necessary code.
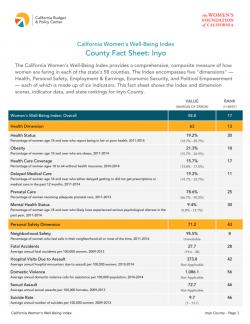
The impact of the index will come as policymakers and advocates work at the county level, and that’s where downloadable PDF reports are key. For each county, you can download a well-designed, two-page report that lays out all the metrics in the index and the ranks of the county. With such a strong handout at a critical hearing or meeting, advocates have an incredible resource at hand as they make the case for improving the lives of women across the state.
Focus: Public Health, Social Justice/Equity
Services: Interactive Solutions, Communications, Graphic Design, Applications Development, Website Design
“ This has been a wonderful collaboration for us on all counts. We're so grateful for your team's work.”
— Steven Bliss, Director, Strategic Communications
Project Years: 2016