See This Project | Similar Projects | All Projects for Client
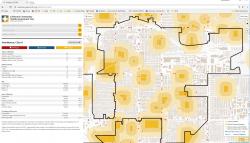
GreenInfo Network and Stanford Prevention Research Center (SPRC) have released the California Tobacco Health Assessment Tool (CTHAT). Using the recently released California School Campus Database (CSCD) alongside Census demographics and tobacco point of sale locations, we have built an informative and responsive site. This release is in tandem with the release of CSCD and is an example of how the dataset can be used in spatial analysis.
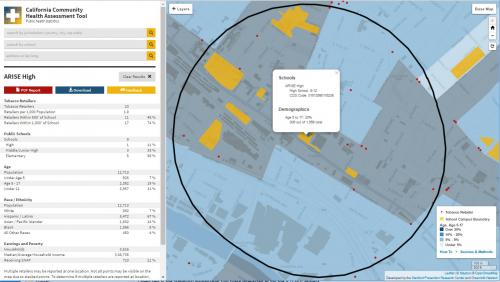
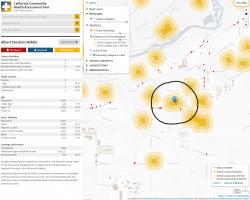
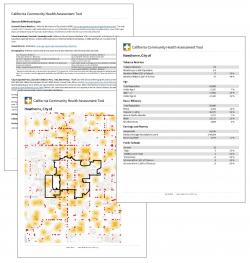
CTHAT generates statistics on the correlation of tobacco retailers, schools, and demographics - such as race, age, and income. Users can quickly fetch statistics for thousands of locations in California: counties, cities, schools, zip codes, or address. The results are displayed on the map and in a table. They are also made available for download in PDF report or in an Excel table. Reported statistics include:
- Tobacco retailers: number, location, distance to schools
- Schools: number, types, distance to tobacco retailers
- Demographics: age, income, poverty, race/ethnicity
Users can:
- Identify locations on the map to find out additional details about each layer
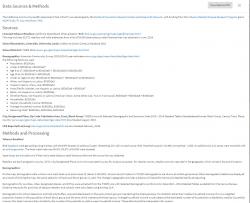
- Download a report for offline use, complete with the map, statistics, and data sources
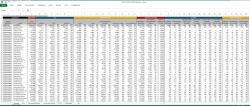
- Download an Excel table to view the results of all cities, counties, and zip codes
- Share a link with others, zoomed to an area of interest, showing user-selected data layers
Technical notes: The website front-end is written in ReactJS and Bootstrap, with a back-end PostGIS database. Data endpoints are written in PHP. Most statistics (counties, cities, zip codes) were pre-generated offline. This use of pre-calculated statistics when available, gives near-instant reports in a large majority of use cases. In cases where this was not feasible (10,000 schools and user-selected point locations) the calculations are made on-demand using CSCD, BOE dataset of tobacco retailers, and US Census Bureau census block group data.
Results: All 61 local health departments are using the school boundary data to investigate tobacco retailer and tobacco marketing near schools as part of a statewide campaign: Healthy Stores for a Healthy Community.
Focus: Environment, Public Health, Social Justice/Equity
Services: Interactive Solutions, GIS Services, Analysis, Maps, Cartography, Web Mapping
Tags: California, CSCD, Health, school, tobacco, Zip code demographics
“ Thanks so much - I'm so excited that folks will get to hear about the importance of using school boundaries and use the wonderful tool you have created!”
— Nina Schleicher, Ph.D, Stanford Preservation Research Center
Project Years: 2016