The California State Parks Foundation charged UCLA and GreenInfo with answering the question: Who lives within easy reach of a California State Park? It's easy to imagine that most state parks are remote and perhaps even inaccessible to many Californians, but our data and analysis show otherwise: In fact, more than half of people under 18 in California live within the “visitorshed” of one or more of our 282 state park units, and that percentage is even higher for disadvantaged and severely disadvantaged households.
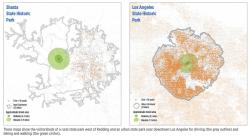
We worked closely with frequent collaborator Jon Christensen on extensive data development and analysis to define three "visitorsheds" for each state park, for people walking, biking and driving. Since local context is important, we also classified parks as either urban or rural and defined different acceptable distances for each one, assuming that rural residents tend to travel farther than urban residents. We tested multiple approaches to defining visitorsheds and settled on network analysis for drivesheds (distance based on road network) and simple buffers for walking and biking, since it's more difficult to get accurate metrics at those short distances.
With our visitorsheds defined, we did extensive analytical work, drawing from the U.S. Census, California Protected Areas Database, CalEnviroScreen, and other sources to understand the populations in each of those visitorsheds.
Finally, we designed and produced both
an eight-page print report to convey high-level policy recommendations and a
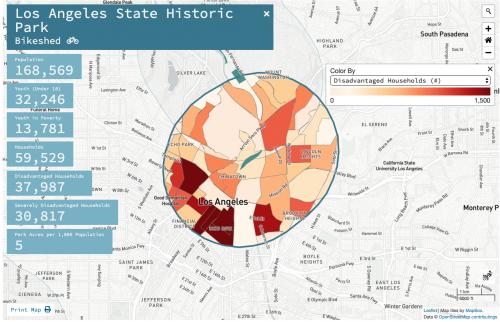
rich interactive map to allow park advocates and others to drill down to each individual park and better understand the local community served by that park.
This analysis is now part of a larger conversation about how our State Parks can best provide youth, and especially youth in poverty, with safe and accessible outdoor experiences.
Focus: Public Health,
Recreation,
Social Justice/Equity
Services: Interactive Solutions, GIS Services, Communications, Graphic Design, Analysis, Data, Maps, Cartography, Applications Development, Web Mapping, Website Design
Project Years: 2019