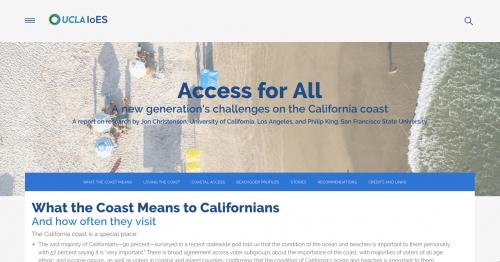
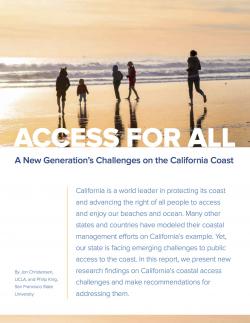
California's Coastal Act, which turned 40 years old in 2016, is a landmark achievement in public access. But there's much more work to be done and new challenges to face in ensuring widespread access to the coast. To help meet the challenge of the next 40 years of coastal access, we designed compelling interactive and print reports for an important study about the future of coastal access in California. We developed the story, visuals, and animations in close collaboration with our client, Jon Christensen of UCLA's Institute of the Environment and Sustainability and Laboratory for Environmental Narrative Strategies. Christensen also worked with and Philip King, professor of economics at San Francisco State University, and the work was supported by Resources Legacy Fund and led to prominent coverage in the LA Times, Orange County Register, kcet.org, and other outlets.
For this project, we wanted tell a directed narrative story in ways that worked in print, on the one hand, and on web and mobile, on the other. In print, that meant compelling photos and bold titles in a concise eight-page report meant for distribution among key legislators and other decision-makers. The print report was complemented with a one-page insert specifically highlighting key issues in Southern California. The two pieces together created a comprehensive statewide story that was also tailored to the region home to the majority of Californians.
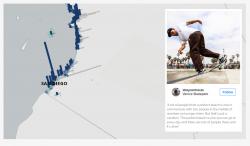
For the interactive version of the report, we broke out of the now-traditional interactive map model that treats online maps as multipurpose tools and instead developed a purpose-built scrolling narrative that combines the best of an array of digital technologies, from boldly colored static maps made with Esri's ArcMap to frame-animations made with ArcPro to simple interactive maps on Carto.com's free platform. The result is a story experience where each kind of data is presented at the point in the story where it's relevant and in the way that's most compelling for that datapoint. Some maps, like measurements of Instagram posting in coastal parks, work beautifully as scrolling animations. Others, like a map of every coastal access point in California, are better as standard web maps with clickable points. Check out
this blog post to learn how we made the animations.
Focus: Environment,
Recreation,
Social Justice/Equity
Services: Interactive Solutions, GIS Services, Communications, Graphic Design, Publications, Maps, Web Mapping, Website Design
Tags: animation,
ArcGIS Pro,
California,
coast,
coastal justice,
Esri ArcGIS
Project Years: 2016, 2017