Similar Projects | All Projects for Client
For a foundation that focuses its giving mainly on one major city, knowing the geography of that place can be very helpful to informed grantmaking. The Metta Fund aims to improve the health and well-being of residents of San Francisco, with special focus on those organizations who serve people with such needs, and asked GreenInfo to help it visualize the city.
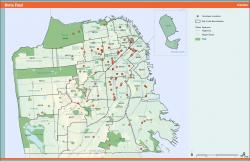
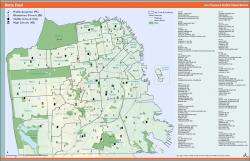
To help the Metta Fund's staff and trustees evaluate their grant making, GreenInfo prepared a series of basic maps that could be used as overlaid images in PowerPoint presentations as well as be printed out as small posters. Most of this mapping was very basic but one particular map was developed using a compelling technical strategy to clearly show where people lived.
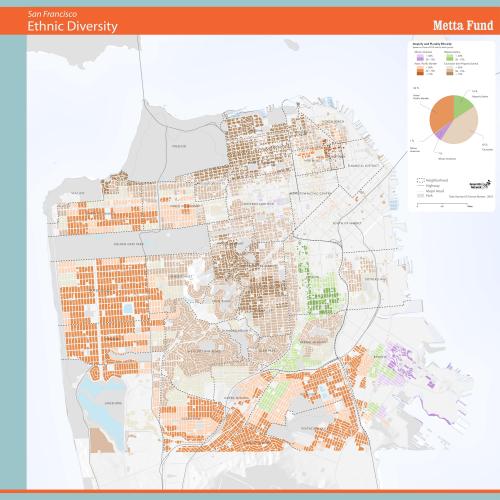
Most demographic maps use data directly from the U.S. Census, showing characteristics for census tracts, block groups and blocks. However, this approach creates an unclear visualization of most places - it doesn't allow for removing the areas where people are not actually residing (for example, commercial office districts or warehousing areas). GreenInfo staff solved this problem by using the City of San Francisco's building footprint data, querying out non-residential structures, and then integrating Census block data on race into those remaining residential areas. One way of understanding this is to think of the census data as "dough" and the more intricate pattern of the residential structures as a "cookie cutter" - once you clear away the non-residential dough, you see the demographic data applied to just the areas where people live.
To finish the map, we graduated the degree of ethnic concentration into three values for each major racial/ethnic group. We used plurality or majority to assign the dominant class to each block.
The resulting small poster map delivers an unusual and intriguing view of San Francisco's population, and has won several awards for outstanding cartography.
Focus: Human Services, Philanthropy
Services: GIS Services, Maps, Cartography
Tags: demographics, Esri ArcGIS, San Francisco
Project Years: 2012-2012