Understanding the monitoring of surface water in California
California is famous for its highly engineered water system. We move millions of gallons of water from north to south and east to west. We have among the most complex systems of any society in history, and yet we know surprisingly little about how
much water is moving through our streams at any
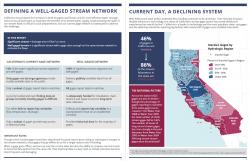
given time. As our climate becomes increasingly erratic, that becomes more and more of a problem. California just survived five-year drought followed by one of the wettest winters on record but only 54% of our historic stream gages remain active.
The gage network overall is quite large — there are over 3,600 locations in California where stream gages have been active at some point — but even with historical data and thousands of gages, GreenInfo needed the combined skills of many of our team to answer this seemingly simple question?: "What is the status of stream gage monitoring in California?"
We took a a phased approach allowed to move through data collection, development, and results on a tight timeline (9 months!).
Phase 1: GIS staff started off with the collection of existing data on gages. With multiple databases (CDEC, USGS, NSIP, NWIS, NOAA), we needed to test for duplicates (while retaining attributes from multiple sources), crosswalk attributes, and collect information that is present on websites but not readily available for download. Using scripts, data scraping, and conversations with current data managers, we compiled what we believe to be the most comprehensive database of gages in California with over 4,000 records.
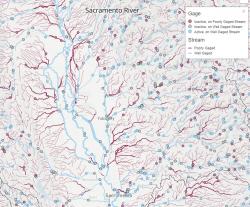
Phase 2: Using that database, we next snapped all of the gages to the project-specific river network (described in phase 3). Gage locations from data providers were often estimated, gages on large rivers might be placed far away from a linear representation (polyline) of a wide river, and some gages simply had incorrect data reported. To improve accuracy, we used a method of fuzzy matching when snapping a gage to a river. The fact that a gage may not be closest in distance to the river it is actually on meant we needed to compare the attributes of each gage to multiple rivers it was near to find the best match.
Phase 3: Alongside phase 2, GIS staff worked with the National Hydrological Dataset (NHD Plus V2) to extract the important information needed in the gage adequacy testing. We processed data on stream name, class, drainage area, velocity, and upstream and downstream connections to create a project-specific version of NHD.
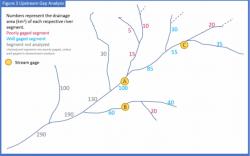
Phase 4: Using the gage and river databases we created earlier, we worked on scripts to evaluate each river segment for its adequacy of gaging. We first made a script to look upstream from each segment and evaluate if it was adequately monitored by any upstream gage. Then we reversed the direction and looked downstream of each river segment to determine if a downstream gage was close enough to monitor the segment being tested.
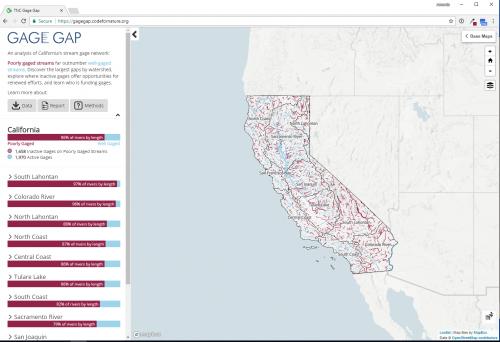
Phase 5: Once the data phases were complete, design and interactive staff led the development of a web application geared toward decisionmakers and researchers concerned with water flows across the state. The tool needed to provide results that are both concise and informative. Gage Gap met these goals by:
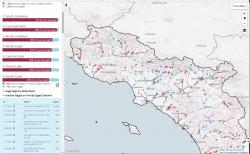
- Providing regional and local watershed views
- Allowing for 3 key perspectives:
What areas are the least monitored?
Where might we be able to re-activate gages?
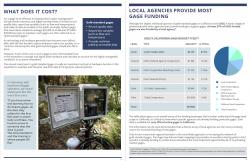
Who currently funds gages?
- Offering state and regional reports with summary and region specific data
Results:
To answer the human (drought/flood) and environmental (flora/fauna) questions related to river flows we produced databases, reports, and an interactive tool. Each are useful in the quest to understand the adequacy of gaging on a local, regional, and statewide scale.
The primary deliverable of Gage Gap met the need for TNC staff and others to readily explore the status of gages in California. While it's not news that our stream gage network has declined, Gage Gap allows users to better define and explore the gaps in the network - the first step to helping close them.
Use the site to:
- Prioritize need
- Identify opportunities
- Obtain quick summaries and facts in concise and informative reports
- Download the full databases of gage and river data (including gap analysis) for advanced uses
Focus: Conservation,
Environment
Services: Interactive Solutions, GIS Services, Communications, Graphic Design, Presentations, Strategy, Analysis, Data, Applications Development, Web Mapping
Tags: California,
climate change,
Delta,
Esri ArcGIS,
Gap Analysis,
GIS data,
Water management
“
Hooray! Congrats all on getting this done! I am very impressed with the level of effort that went into this and the professional quality of the output products. There is currently some momentum to increase gage funding in the state. Perfect timing!
I want to thank Amanda especially for spearheading this effort and coordinating a big team on the GIN side, and to Dan for proving high level guidance and direction to ensure these products have impact. I’m looking forward to working with you guys in the future!”
— Kirk Klausmeyer, Senior Spatial Data Scientist
Project Years: 2017