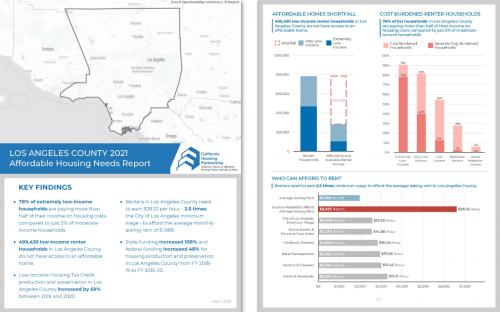
Each year, the California Housing Partnership (CHPC) produces 58 variations of a housing needs report for every county in California, helping local affordable housing advocates make the case for funding housing in their communities. They came to GreenInfo for help in designing and developing a new set of PDFs that could be generated automatically, and use the same data to power an interactive dashboard.
First we developed refined and simplified new PDF report designs based on the existing manually produced reports, and then over many iterations we developed the scripted automation processes to reliably produce presentation-quality PDFs from spreadsheet data.
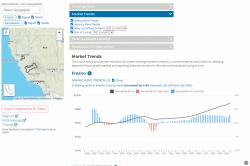
At the same time, we repurposed the visual language, the data, and the chart types for interactive versions, which additionally provide historic views and other web-only slices of the data. The web dashboard also allows for almost infinite comparisons between counties across a range of metrics.
Between the highly polished PDF downloads and the fully custom interactive charts, users can find what they need to understand housing needs across California and to make the case for funding those needs.
We developed the charting with Highcharts.js and built the application on the Django application framework, using Python to batch generate the PDFs.
In 2021 we continued working with CHPC and provides more updates. We expanded filter options to include regional aggregations in addition to the existing geographic options; built in new functionality that allows for charts to download as PNGs, so users can utilize charts outside of the tool itself; modified, updated, and added chart options, such as including a new version that breaks down data by race and ethnicity; refactored some data visualizations across the website; provided programmatically generated PDFs of information; and more!
Focus: Economic Development,
Social Justice/Equity
Services: Interactive Solutions, Communications, Graphic Design, Applications Development, Website Design
Project Years: 2020, 2021, ongoing