Few issues are more pressing than affordable housing in California right now. From tech-boom cities like San Francisco and Oakland to rural areas affected by wildfires, the cost and availability of housing is on nearly everyone's minds. So we were thrilled to get the opportunity to work with the California Housing Partnership (CHPC) to map the organization's database of more than 400,000 affordable housing units across the state.
What made this project really special was the lens through which CHPC views this data: Each of those units not only is someone's home. We all as a society benefit from affordable housing. People with secure housing get and keep better jobs, stay healthier, and raise children who achieve better educational outcomes. And those outcomes aren't only feel-good stories (though that would be enough for us!). The cost savings and increased tax revenues tally into the hundreds of millions and even billions of dollars. When viewed in this way, supporting affordable housing becomes not just the right thing to do but also the economically rational thing to do.
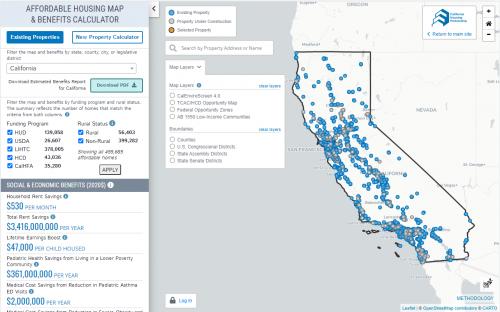
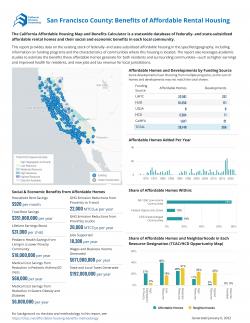
The web tool we developed makes it easy to search for specific properties, filter by funding type, or generate quick summaries by county or senate and assembly district, to understand how the benefits play out across the political landscape. Those area reports can also be downloaded as dynamic PDF reports.
Because CHPC updates their housing data regularly, we also built a robust yet simple backend system to allow their team to upload new versions of the data at any time and publish that live to the application.
In 2021, we continued our work with CHPC and provided updates to the project. We interviewed users to better understand how they use the tool, and look for ways to improve the functionality; redesigned the sidebar to improve the information hierarchy and legibility; made the search and filter options more straightforward; we overhauled the the PDF report design to include additional statistics and charts; created a password-protected version so CHPC could share sensitive data with trusted partners; and more!
The system is built with Python/Django on the backend and custom Javascript/HTML/CSS on the front end, and designed to be embedded inside an iframe on CHPC's Wordpress-powered website.
Focus: Human Services,
Social Justice/Equity
Services: Interactive Solutions, Applications Development, Web Mapping, Design Research
Project Years: 2019, 2021