See This Project | Similar Projects | All Projects for Client
Parks and other protected areas cover over 3 billion acres in the U.S. and its territories - the PAD-US database is the official national inventory of these lands and waters, published by the USGS Gap Analysis Project. GreenInfo has been a longtime partner with USGS on PAD-US and was asked to refine and develop a system of maps to showcase PAD-US data.
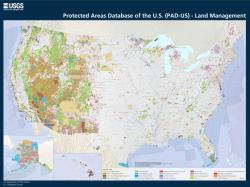
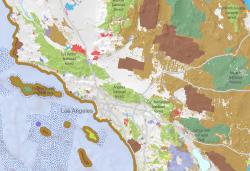
GreenInfo GIS staff worked on several different versions of a template map, on which variations could be based. We used the general look and feel for the USGS GAP program that we had developed earlier for the map frame, and then started in on the cartography. The base map uses a hillshade to allow the topography of the country show through the map data. We originally developed this visualization with different colors for elevations, but for this generation of maps determined that a brighter map would be more effective, leading us to choose a more monochrome hillshade color "ramp".
Building the labels was a major effort. State names, major cities, and large parks plus rivers all needed to have their own identity and to be placed so that they allowed the viewer to easily read them and not be confused with surrounding map information. Some of this information was imported from prior GreenInfo work on a map poster for the 50th Anniversary of the National Wilderness System.
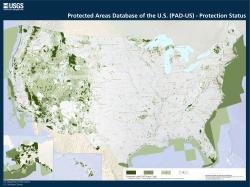
Finally, we brought in the very large PAD-US data set (150,000 holdings by over 15,000 agencies) and classified it based on different themes - by agency manager/type; by "GAP" status (a measure of biodiversity conservation), by public access (open, restricted, closed) and for federal agency managers only. Each of these required careful attention to colors and fills and to the interaction between layers of map information, in order to have a harmonized final map for each theme.
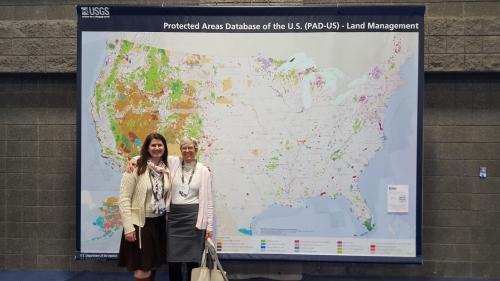
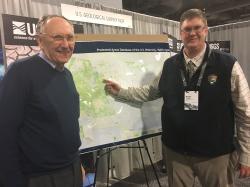
The maps are being printed by USGS for selected distribution. At the February 2017 Esri Federal Users Conference, the map was printed by Esri at 12'x8' size (see image), and was featured by Esri CEO Jack Dangermond in his keynote address (Jack and the NPS Chief Cartographer are in one of the images at left - Lisa Johnson, the PAD-US Coordinator is in another image, on the left side of the photo.
This project gives USGS a map framework that will last for some time, allowing its staff to develop variants more easily and to work with GreenInfo on different versions as well. It's a good example of how effective GreenInfo can be in creating custom maps that have real impact.
Results: The maps have been actively displayed and printed by USGS, and can be downloaded as PDF (large files) or JPGs: https://gapanalysis.usgs.gov/padus/resources/
Focus: Conservation, Environment, Government Agencies
Services: GIS Services, Maps, Cartography
Tags: Esri ArcGIS, PAD-US, Protected Areas
Project Years: 2016-2017