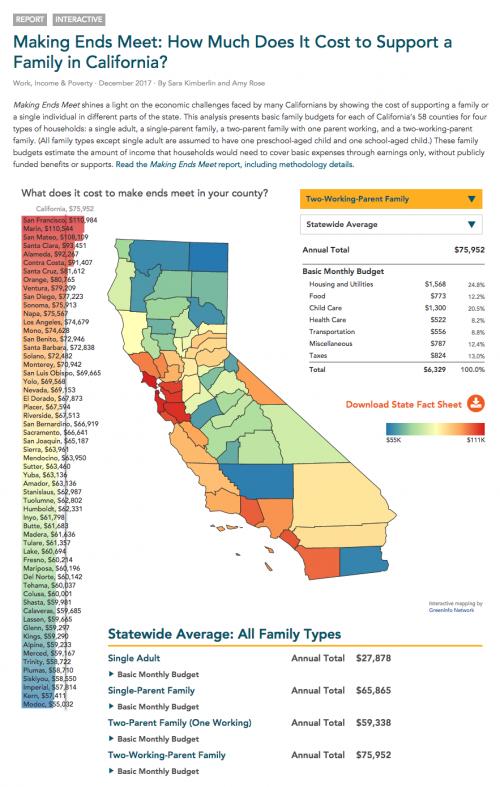
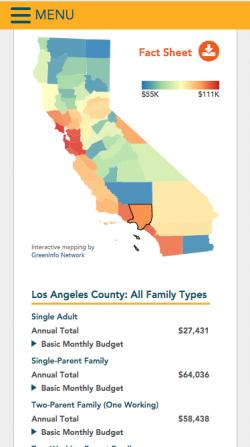
When the California Budget and Policy Center decided to update their popular 2015 Making Ends Meet report about the cost of living in California, they came to us for a new and upgraded interactive version of the data. Starting from the work we'd already done together previously, we developed a striking, simple, mobile-friendly map to help communicate the challenges families face across the state.
Starting from the visual design and underlying code for our successful
Women's Well-Being Index map, we developed a new version optimized to the county-by-county cost of living data that the Budget and Policy Center assembled for the project.
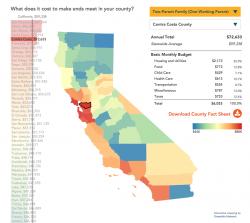
The project focused on making sure the interactive worked as well on mobile phones as it does on large screens, and also that it maintained the on-brand look and feel of
CalBudgetCenter.org.
A secondary goal was to abstract the code for the map and move a step closer to allowing for easy reuse of the county-level map and bar chart in future projects. A key part of that is running the application from two linked text files, spreadsheets exported in CSV format. So data is easily accessed and edited by nontechnical staff, and then can be quickly deployed.
Focus: Economic Development,
Social Justice/Equity
Services: Interactive Solutions, Web Mapping
Project Years: 2017