See This Project | Similar Projects | All Projects for Client
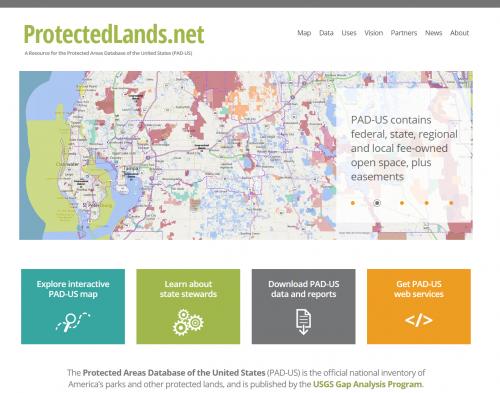
The USGS Gap Analysis Project (GAP) publishes the Protected Areas Database of the U.S. (PAD-US), the official federal inventory of all public parks and protected open areas in the country. GreenInfo has been a longtime partner with GAP, going back to a project to define a new vision for the data set, and also because GreenInfo manages protected areas data for California, the state with the largest array of such lands in the U.S. To mark the release of a major update to PAD-US, GAP staff asked GreenInfo to develop a companion website to the official site at USGS.gov.
The web site was developed using the Wordpress CMS, with some modifications.
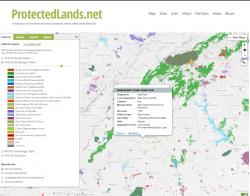
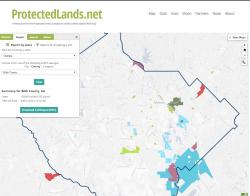
The mapper for the site was written in Leaflet and jQuery, with PostGIS as the back-end database. One of the interesting features of the mapper is that it allows turning on/off individual agencies or other classes within any of the views of PAD-US - this helps users sort out what is in PAD-US for an area and compare it to base maps data.
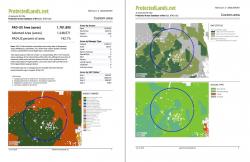
A key feature of the mapper is its reporting module, which allows users to generate PDF summary reports for counties, congressional districts and other geographies. Generation of a report for an area can take two to three minutes, due to the sheer volume of PAD-US data. To reduce waiting times, a caching system was built into the reporting system. This saves the statistics of previously-requested areas, so that subsequent requests for the same report can be generated in only a few seconds. Download a sample of a report.
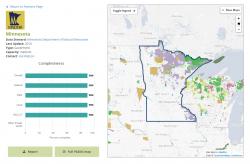
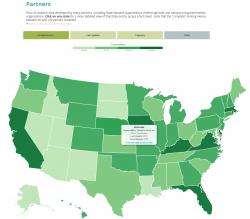
For showcasing state data partners, we used a basic mapping framework that we had developed for another project, and adapted it to support the PAD-US uses. As an extra detail, we allowed clicking on a state to open up a state detail window that shows core steward information as well as a live web map of that state.
Finally, we developed a basic posting system for creating and publishing short examples of how PAD-US is being used. These use cases provide introductions to how PAD-US data is being applied to conservation, land use planning, public health, recreation information and many other types of applications.
Focus: Conservation, Environment, Government Agencies
Services: Interactive Solutions, Web Mapping, Website Design
Tags: PAD-US, parks, Protected Areas, united states
Project Years: 2015-2016